
The reference tables display fixed values for each age, as if growth followed a single track. For a 13-year-old girl, a height figure and a weight figure are often read as universal benchmarks. However, these averages mask rapidly changing physiological realities: earlier puberty than thirty years ago, increasing prevalence of overweight among adolescent girls, and individual variations that standard curves struggle to capture.
Early puberty and body composition at 13: what averages don’t show
A 13-year-old girl in 2024 is, on average, more advanced in her pubertal development than a girl of the same age thirty or forty years ago. This advancement in puberty directly alters body composition: more fat mass, faster weight gain over a shorter period, and sometimes a final height reached earlier.
The growth curves in health records, whether French or international (WHO), have been constructed from cohorts that do not always reflect this recent reality. When a parent compares their daughter’s weight to the “average” displayed, they are actually comparing it to a reference that may be decades old.
To better situate the average height and weight of a 13-year-old girl, these figures should be read as a starting point, not as a verdict. With the same body type, two 13-year-old girls can follow very different height and weight trajectories depending on their environment, diet, or individual pubertal pace.

Overweight among adolescent girls: a missing data point in average weight tables
Most articles discussing average weight at 13 simply cite a single value. This figure, by its nature, smooths out the actual distribution. However, the likelihood that a 13-year-old girl is overweight or obese is now significantly higher than at the beginning of childhood.
This information changes the interpretation of the curves. A weight above the 50th percentile does not automatically indicate excess weight. In contrast, a BMI that crosses the 97th percentile on the body mass index curve indicates obesity, regardless of the gross weight displayed on the scale.
Why BMI alone is not sufficient at this age
Body mass index relates weight to height squared. In an adolescent experiencing a growth spurt, this ratio fluctuates rapidly. A rapid weight gain can precede a peak in height growth, and BMI normalizes within a few months thereafter.
The pediatrician does not look at an isolated value. They observe the trajectory: an upward shift on the body mass index curve is a more reliable warning signal than a single number. It is the dynamics that matter, not the snapshot at a given moment.
Girl’s body mass index curve: reading percentiles without panic
The curves in health records outline percentile corridors. The 50th percentile represents the median, not a target to reach. Being at the 25th or 75th percentile is equally normal, as long as one stays within the same corridor over the months.
- Adiposity rebound occurs on average around age 6. The earlier it happens, the greater the risk of later overweight, including during adolescence.
- A shift upward between ages 10 and 13 warrants a consultation, even if the weight remains within the so-called “normal” range.
- Parental height, level of physical activity, and dietary habits influence the position on the curve as much as age itself.
Plotting BMI on the sex- and age-appropriate body mass index curve remains the method recommended by pediatricians. Online calculators can provide an initial indication, but data interpretation should be done by a healthcare professional.
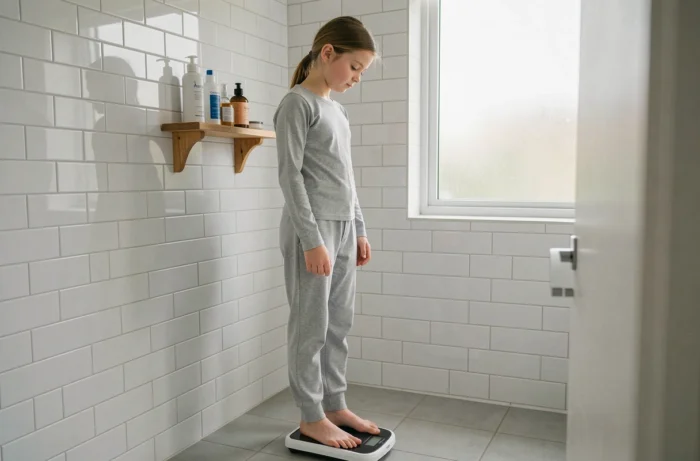
Environmental factors and growth trajectory at 13
Reducing an adolescent’s growth to her genetics would be a mistake. Recent data shows that the environment weighs heavily in the equation, sometimes as much as heredity.
Nutrition and sleep
The nutritional quality during puberty shapes body composition. An excess caloric intake promotes fat mass storage, while a deficit can hinder height growth. Sleep plays a often underestimated role: growth hormone is primarily secreted during deep sleep, and adolescents who sleep less than eight hours a night exhibit different growth profiles.
Physical activity and sedentariness
The increasing sedentariness among adolescent girls alters the fat mass/lean mass ratio without visible changes in total weight. Two girls showing the same number on the scale can have radically different body compositions depending on their activity level.
Validated protocols exist to support adolescents whose weight trajectory deviates. They combine dietary rebalancing, adapted physical activity, and regular medical follow-up. These approaches can effectively change the weight curve, provided they are implemented with a pediatrician or a nutritionist.
What “normality” really means in adolescent growth
The concept of average weight or average height for a 13-year-old girl is based on population statistics. It describes a center of distribution, not an individual norm. An adolescent at the 10th percentile for height who consistently follows her growth corridor is as healthy as another at the 90th percentile.
Parents consulting online tables often seek reassurance. The raw number does not provide that. What truly reassures is the consistency of the curve and the absence of breaks or sudden accelerations.
- Measuring height and weight every six months is sufficient unless there are specific warning signs.
- Systematically plotting values on the health record curve, not just comparing them to an online table.
- Consult if the percentile corridor changes by two zones or more in less than a year.
The growth of a 13-year-old girl is read over time. A single number, even “average,” never tells the whole story. Longitudinal follow-up with a professional remains the only reliable tool to distinguish a normal variation from a signal that deserves attention.